

Research Article
Received: 2026-02-27 | Revised:2026-04-11 | Accepted: 2026-04-13 | Published: 2026-04-30
Pages: 117-126
DOI: https://doi.org/10.58985/jafsb.2026.v04i01.96
Abstract
Mutations
produce raw materials for the genetic improvement of economically important crops.
Genetic improvement of underutilized legumes requires the generation of novel
variability that exceeds the limitations of natural recombination. Vigna
subterranea (L.) Verdc., commonly known as Bambara groundnut, is valued for
its drought resilience and nutritional quality, yet breeding progress has been
slow due to its narrow genetic base and self-pollinating nature. This study
investigated the capacity of ethyl methanesulfonate (EMS) to induce heritable
variation and improve yield performance in two varieties, brown and cream.
Seeds were exposed to six EMS concentrations (0.00–0.5%) and evaluated across the
M1 and M2 generations using agronomic traits and RAPD-based molecular analysis.
The mutagen treatments generated substantial polymorphisms with polymorphic
information content values between 0.5025 and 0.9103 and gene diversity
estimates ranging from 0.5278 to 0.9167. Phylogenetic clustering separated the treated
lines into two principal groups with multiple sub-clusters, indicating a clear
genetic divergence from the untreated controls. Yield components responded
positively to moderate EMS doses. In M1, peak yields occurred at
0.3% for brown (129.33 g/plant) and 0.4% for cream (125.00 g/plant). Enhanced
performance was more evident in M2, where brown at 0.3% produced
138.67 g/plant and cream at 0.5% yielded 135.67 g/plant. Improvements in
100-seed dry weight, reaching 5.09 g, further demonstrated mutagen
effectiveness. The findings confirm that carefully optimized EMS application
can broaden the genetic base of Bambara groundnut and generate stable,
high-performing lines suitable for future breeding programs and adaptation to
diverse agro-ecological conditions.
Keywords
Vigna subterranea, EMS mutagenesis, genetic diversity, RAPD markers,
yield enhancement, molecular variation.
1. Introduction
Bambara
groundnut (Vigna subterranea [L.] Verdc.) is a drought-tolerant African
legume cultivated mainly by smallholder farmers using low-input systems. Its
nutritional value and adaptability to poor soils make it important for food
security in semi-arid regions [1–3]. In
addition, crops contribute to soil fertility through biological nitrogen
fixation [4, 5].
The
species is believed to have originated in West Africa, particularly between
northeastern Nigeria and northern Cameroon, where both cultivated and wild
forms exist [2, 6]. Despite its importance,
genetic improvement has been slow due to its self-pollinating nature and
limited genetic variability, which restrict the effectiveness of conventional
breeding methods [7, 8].
Induced mutagenesis offers an alternative approach for generating novel variations. Ethyl methanesulfonate (EMS) is widely used because it produces heritable point mutations through base substitutions, thereby altering gene function [9, 10]. It is relatively inexpensive, non-transgenic, and suitable for diverse plant materials [11, 12]. However, its effectiveness depends on the careful optimization of treatment conditions to avoid excessive damage [13, 14]. Molecular markers, such as RAPD, provide a rapid means of detecting induced genetic variation and assessing relationships among genotypes [15, 16]. This study evaluated the impact of EMS on genetic diversity and yield traits in Vigna subterranea, with the aim of supporting its genetic improvement.
2. Materials and methods
The study employed a Randomized Complete Block Design (RCBD) with three replicates. For each treatment, 10 plants were maintained per replicate under open field conditions in Item Bende Local Government Area, Abia State, Nigeria. Routine agronomic management practices were implemented uniformly throughout the experimental period.
2.1. Seed materials and treatments
Seeds
were treated with ethyl methanesulfonate (EMS) at concentrations of 0.00%,
0.1%, 0.2%, 0.3%, 0.4%, and 0.5% (w/v). After soaking in the EMS solution for a
defined period, the seeds were thoroughly rinsed with sterile
distilled water to eliminate chemical residues [17–19].
2.1.1. Seed sterilization
To
minimize contamination, seeds were surface-sterilized in 70% ethanol for 1 min,
followed by immersion in 5% sodium hypochlorite for 5 min and rinsed three
times with sterile distilled water [20].
2.1.2. Germination
setup
Germination
was carried out in Petri dishes lined with moistened filter paper. Each dish contained
10 seeds per treatment group, and 5 mL of distilled water was added to maintain
moisture. The dishes were incubated at 25 28 °C with a 12-hour light/dark cycle
for 7 days [20].
2.1.3. Seed treatment
Chemical
mutagenesis was performed using ethyl methanesulfonate (EMS), with dimethyl
sulfoxide (DMSO₄) as a solvent to enhance mutagen absorption through the seed
coat. This combination is commonly used to increase the mutation efficiency.
2.1.4. Pre-soaking
Seeds
were soaked in 200 mL of distilled water for 6 h to soften the seed coats and
improve mutagen uptake. After soaking, the samples were air-dried for 20 min to
avoid oversaturation.
2.1.5. Preparation
of EMS-DMSO₄ solutions
EMS
solutions at 0.00% (control), 0.1%, 0.2%, 0.3%, 0.4%, and 0.5% (w/v) were
prepared in buffer solution 7 [21]. DMSO₄
was added to enhance EMS penetration. Solutions were freshly prepared before
use to maintain their effectiveness.
2.1.6. Mutagenic
treatment
Pre-soaked
seeds were immersed in EMS-DMSO₄ solutions for 6 h. The beakers were gently
agitated periodically to ensure even exposure. DMSO₄ improved EMS uptake and
promoted uniform mutagenesis.
2.1.7. Post-treatment
washing
After
treatment, the seeds were rinsed under running tap water and washed five times
to eliminate residual chemicals. They were then air-dried for 30 min before
sowing [22].
2.2. Data collection
2.2.1. Yield assessment
Data
were collected when the plants reached physiological maturity to evaluate the
effects of each treatment on yield. The following parameters were recorded:
2.2.2. Number
of pods per plant
Pods
from each plant were individually counted to determine pod production.
2.2.3. Dry weight
per plant
Harvested
pods were dried in an oven at 60 °C for 72 h to remove moisture. The dried pods were then weighed to
determine the dry matter per plant, which reflects both the yield quantity and
quality.
2.2.4. 100-Seed
weight
A
sample of 100 seeds was randomly selected from each treatment group and weighed
to assess seed size and uniformity.
2.2.5. Yield per
plant (g)
After
threshing, the total seed weight per plant was measured in grams to quantify the
overall productivity.
These
measurements provided a comprehensive evaluation of plant yield performance
under the experimental treatments.
2.2.6. Genomic
DNA extraction from Vigna subterranea
The
extraction of genomic DNA from Vigna subterranea was performed using the
CTAB (cetyltrimethylammonium Bromide) method, as described by [23]. This method is widely recognized for its
effectiveness in obtaining high-quality DNA suitable for molecular analyses,
such as polymerase chain reaction (PCR) and genetic fingerprinting.
2.2.7. Sample
collection and DNA extraction
Fresh
plant tissue was ground with liquid nitrogen, and incubated in CTAB buffer at
65°C for cell lysis. DNA was separated using chloroform: isoamyl alcohol (24:1)
and centrifugation. The aqueous phase was collected, and DNA was
precipitated with cold isopropanol or ethanol, followed by centrifugation. The
DNA pellet was washed with 70 % ethanol, air-dried, and resuspended in TE
buffer or distilled water. If, required RNase is used to remove RNA. The
extracted DNA was stored at -20 °C for molecular applications [23].
2.2.8. Agarose
gel electrophoresis
The
quality of the DNA was checked by running it on a 1.5 % agarose gel stained
with ethidium bromide. The stained gel was photographed using a gel
documentation system (Kodak EDAS 290). DNA concentration and purity were
further quantified using a spectrophotometer at 260 and 280 nm, and appropriate
dilutions were made for subsequent SSR analyses.
2.2.9. DNA amplification
via PCR
Polymerase
chain reaction (PCR) was carried out using five RAPD primers. The 15 µL
reaction mixture consisted of 20 ng genomic DNA, 1.5 µL of 10X reaction buffer,
1.5 µL of 10X dNTPs, 0.5 µL of magnesium chloride (25 mM), 1 µL of primer, 1 µL
of Taq polymerase, and 8.5 µL of nanopure water. Amplification was performed
using a programmable thermal cycler under the following conditions: an initial
denaturation of 1 cycle at 35°C for 1 min, 72 °C for 2 min, and 92 °C for 3 min;
followed by 44 cycles of denaturation at 92 °C for 1 min, annealing at 35 °C
for 1 min, and extension at 72 °C for 2 min. A final extension was performed at
15 °C. The PCR products were resolved on a 1.5% agarose gel in TAE buffer,
stained with ethidium bromide, and visualized under UV light using a Kodak EDAS
290 system.
2.3. Molecular
data analysis
For RAPD-PCR analysis, only distinct and reproducible amplification bands were scored, assigning a presence (1) or absence (0) to each band as appropriate. To ensure consistency, the bands were scored independently by two researchers across repeated PCR runs. Polymorphism Information Content (PIC) was calculated to assess marker informativeness using the formula: where Pi represents the frequency of the i-th band. Cluster analysis and Principal Component Analysis (PCA) were performed using NTSYS (Numerical Taxonomy and Multivariate Analysis System) Version 2.01i, applying Jaccard’s similarity coefficient to assess genetic relationships. A dendrogram was constructed using the Unweighted Pair Group Method with Arithmetic Mean (UPGMA) based on Nei’s genetic distance to classify individuals into distinct clusters. Molecular analysis was conducted using PowerMarker Software Version 3.25 [39] for genetic diversity estimates and allele frequency calculations. Additionally, Darwin 6 software [16] was used for cluster validation and PCA visualization.
3. Results
Table 1 shows the effect of the difference in mutant levels on the yield performance of the two varieties of Bambara in the M1 generation. For the Brown variety in the M1 generation, the highest yield was observed at 0.3% EMS treatment (129.33 ± 17.93), whereas the lowest yield occurred at 0.1% EMS treatment (111.67 ± 7.64). The highest dry weight per seed (DWPS) was recorded in the 0% EMS treatment (3.62 ± 0.49), and the lowest was at 0.1% EMS treatment (3.05 ± 0.23). The dry weight per 100 seeds (DW) was highest in the 0% EMS treatment (4.89 ± 0.69) and lowest at the 0.1% EMS treatment (3.28 ± 0.61).
Table 1. Analysis of variance test on the effect of difference in levels of mutants on yield performance of two varieties of Bambara in M1 generation.
Variety | Treatments (%) | DWPS | DW(100 seeds) | Yield (g/plant) |
Brown | 0 | 3.62±0.49 | 4.89±0.69 | 126.67±8.33 |
| 0.1 | 3.05±0.23 | 3.64±0.56 | 111.67±7.64 |
| 0.2 | 3.22±0.49 | 3.28±0.61 | 112.33±7.57 |
| 0.3 | 2.90±0.64 | 4.21±1.68 | 129.33±17.93 |
| 0.4 | 3.11±0.63 | 3.69±0.50 | 117.33±13.43 |
| 0.5 | 3.38±1.11 | 4.09±1.98 | 124.67±25.48 |
| Total | 3.21±0.60 | 3.97±1.11 | 120.33±14.42 |
Cream | 0 | 2.67±0.58 | 3.25±0.92 | 116.33±13.58 |
| 0.1 | 2.89±0.56 | 2.99±0.68 | 110.67±10.07 |
| 0.2 | 2.94±0.17 | 3.03±0.08 | 111.33±7.02 |
| 0.3 | 3.12±0.76 | 3.38±0.76 | 122.33±12.58 |
| 0.4 | 3.96±1.84 | 4.24±1.88 | 125.00±20.52 |
| 0.5 | 2.92±0.58 | 3.37±0.91 | 115.33±10.60 |
| Total | 3.08±0.88 | 3.37±0.96 | 116.83±12.26 |
Totalmean | 0 | 3.14±0.71 | 4.07±1.16a | 121.50±11.55 |
| 0.1 | 2.97±0.39 | 3.32±0.66ab | 111.17±8.01 |
| 0.2 | 3.08±0.36 | 3.15±0.41b | 111.83±6.56 |
| 0.3 | 3.01±0.64 | 3.79±1.25ab | 125.83±14.37 |
| 0.4 | 3.53±1.31 | 3.96±1.26ab | 121.17±16.07 |
| 0.5 | 3.15±0.83 | 3.73±1.43ab | 120.00±18.19 |
| Total | 3.15±0.74 | 3.67±1.07ab | 118.58±13.31 |
LSDtrt |
| 0.7291066 | 0.8500172 | 15.94574 |
CV |
| 19.34366 | 9.33846 | 11.23051 |
V. Effect |
| 0.526567 | 0.02023* | 0.4389 |
T. Effect |
| 0.657050 | 0.21479 | 0.3633 |
InterEffect |
| 0.224385 | 0.21885 | 0.8507 |
Block |
| 0.001158** | 0.000*** | 0.1217 |
Signif.codes: 0 ‘***’ 0.001 ‘**’ 0.01 ‘*’ 0.05 | ||||
For the Cream variety in the M1 generation, the highest yield was observed at 0.4% EMS treatment (125.00 ± 20.52), while the lowest was at 0.1% EMS treatment (110.67 ± 10.07). The highest DWPS was observed at 0.4% EMS treatment (3.96 ± 1.84), and the lowest DWPS was observed at 0% EMS treatment (2.67 ± 0.58). The highest DW was observed at 0.4% EMS treatment (4.24 ± 1.88), and the lowest was observed at 0.1% EMS treatment (2.99 ± 0.68).
Overall, the findings from the M1 generation indicated that higher EMS concentrations (0.3% and 0.4%) had a more favourable impact on yield and dry weight, particularly in the Cream variety, whereas lower EMS concentrations (0.1%) negatively affected growth parameters in both varieties. Table 2 shows the effect of the differences in mutant levels on the yield performance of the two Bambara varieties in the M2 generation. The harvest data for M2 showed results for two varieties (Brown and Cream), across six treatments (0, 0.1, 0.2, 0.3, 0.4, and 0.5) for three parameters: yield, dry weight (DW), and dry weight per unit (DWPS).
Table 2. Analysis of variance test on the effect of difference in levels of mutants on yield performance of two varieties of Bambara in M2 generation.
Variety | Treatments (%) | Yield | DW | DWPS (g) |
Brown | 0 | 129.33±11.02 | 4.53±0.94 | 3.82±0.61 |
| 0.1 | 117.33±16.65 | 3.55±0.39 | 3.17±0.13 |
| 0.2 | 128.67±1.53 | 4.16±0.68 | 3.64±0.40 |
| 0.3 | 138.67±4.16 | 5.09±0.07 | 4.28±0.27 |
| 0.4 | 133.67±20.79 | 4.97±1.10 | 4.40±0.79 |
| 0.5 | 137.33±11.37 | 5.07±1.13 | 3.78±0.60 |
| Total | 130.83±12.98 | 4.56±0.90 | 3.85±0.60 |
Cream | 0 | 118.00±15.10 | 3.55±0.93 | 3.36±0.66 |
| 0.1 | 124.00±18.33 | 4.03±1.09 | 3.82±1.03 |
| 0.2 | 118.00±10.00 | 3.54±0.34 | 3.22±0.06 |
| 0.3 | 127.00±23.00 | 4.33±1.40 | 3.80±1.17 |
| 0.4 | 134.00±25.06 | 4.40±1.49 | 3.82±1.26 |
| 0.5 | 135.67±4.04 | 3.77±0.33 | 3.27±0.47 |
| Total | 126.11±16.35 | 3.93±0.94 | 3.55±0.79 |
Totalmean | 0 | 123.67±13.35 | 4.04±1.00 | 3.59±0.62 |
| 0.1 | 120.67±16.08 | 3.79±0.78 | 3.50±0.75 |
| 0.2 | 123.33±8.66 | 3.85±0.59 | 3.43±0.35 |
| 0.3 | 132.83±16.11 | 4.71±0.98 | 4.04±0.80 |
| 0.4 | 133.83±20.60 | 4.69±1.21 | 4.11±0.99 |
| 0.5 | 136.50±7.69 | 4.42±1.03 | 3.53±0.56 |
| Total | 128.47±14.74 | 4.25±0.96 | 3.70±0.71 |
LSDtrt |
| 18.37978 | 1.087269 | 0.8537574 |
CV |
| 11.9484 | 21.37623 | 19.27912 |
V. Effect |
| 0.3661 | 0.05028 | 0.2144 |
T. Effect |
| 0.3721 | 0.33031 | 0.4178 |
InterEffect |
| 0.8626 | 0.65427 | 0.6681 |
Block |
| 0.3997 | 0.21149 | 0.2767 |
Signi^⁷f.codes: 0 ‘***’ 0.001 ‘**’ 0.01 ‘*’ 0.05 | ||||
For the Brown variety, yield started at 129.33 and increased to a high of 138.67 at 0.3, then remained 137.33 at 0.5. The dry weight for Brown reached its maximum of 5.09 at treatment 0.3, while DWPS was the highest at treatment 0.4, reaching 4.40. For the Cream variety, the yield increased steadily from 118.00 at treatment 0 to a maximum of 135.67 at treatment 0.5. However, Cream’s DW values were lower than Brown’s, with the highest DW of 4.40 at treatment 0.4. Its DWPS peaks at around 3.82 for treatments 0.1 and 0.4. When the data for both varieties were combined (Total Mean), the yield showed an increasing trend from 123.67 at treatment 0, up to 136.50 at treatment 0.5. Overall, the highest combined Dry Weight is observed at treatment 0.3 (4.71), and the highest overall DWPS is at treatment 0.4 (4.11). The LSD values (18.38 for yield, 1.09 for DW, and 0.85 for DWPS) indicate that differences exceeding these thresholds were statistically significant.
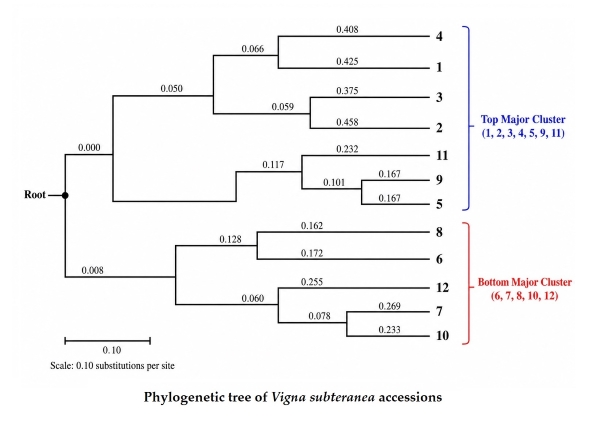
Fig. 1 shows the molecular analysis of two accessions of Vigna subterranea treated with at different concentrations of EMS (0.00%, 0.1%, 0.2%, 0.3%, 0.4%, and 0.5 w/v), which were analyzed using five RAPD markers (OPT-05, OPT-07, OPH-05, OPB-04, and OPB-17) as presented in Table 3, to assess their ability to detect polymorphisms. The DNA quality and RAPD amplification profiles illustrating polymorphic banding patterns across treatments are presented in Plates 1–4. The integrity of extracted genomic DNA is shown in Plate 1.

Figure 1. Phylogenetic tree of Vigna subteranea accessions studied.
Table 3. Primer sequences.
OPT–05 -51–GGG | TTT | GGC | A–31 |
|
OPT–07 -51–GGC | AGG | CTG | T–31 |
|
OPH–05 | -51–AGT | CGT | CCC | C–31 |
OPB–04 51–GGA | CTG | GAG | T–31 |
|
OPB–17 51–AGG | GAA | CGA | G–31 |
|

Plate 1. Molecular weight DNA extraxed from the samples.
Sample codes: 1. BcControl, 2. 0.1%, 3. 0.2%, 4. 0.3%, 5. 0.4%, 6. 0.5%, 7. C. CControl (0.0), 8. C.C0.1%, 9. C.C0.2%,10. C.C0.3%, 11. C.C0.4%, 12. C.C0.5%.

Plate 2. RAPD amplification profile using primer OPT-05 showing polymorphic bands among EMS-treated accessions. Lane M represents 100 bp DNA ladder.
Sample codes: 1. BcControl, 2. 0.1%, 3. 0.2%, 4. 0.3%, 5. 0.4%, 6. 0.5%, 7. C. CControl (0.0), 8. C.C0.1%, 9. C.C0.2%,10. C.C0.3%, 11. C.C0.4%, 12. C.C0.5%.

Plate 3. RAPD amplification profile using primer OPB04 showing polymorphic bands among EMS-treated accessions. Lane M represents 100 bp DNA ladder.
Sample codes: 1. BcControl, 2. 0.1%, 3. 0.2%, 4. 0.3%, 5. 0.4%, 6. 0.5%, 7. C. CControl (0.0), 8. C.C0.1%, 9. C.C0.2%,10. C.C0.3%, 11. C.C0.4%, 12. C.C0.5%.\

Plate 4. RAPD amplification profile using primer OPr07 showing polymorphic bands among EMS-treated accessions. Lane M represents 50 bp DNA ladder.
Sample codes: 1. BcControl, 2. 0.1%, 3. 0.2%, 4. 0.3%, 5. 0.4%, 6. 0.5%, 7. C. CControl (0.0), 8. C.C0.1%, 9. C.C0.2%,10. C.C0.3%, 11. C.C0.4%, 12. C.C0.5%.
Considerable genetic diversity was found among the treated Vigna subterranea accessions. Cluster analysis was carried out to determine the relationship among the treated accessions. The dendrogram showed two main clusters and a total of 11 clusters. RAPDs revealed a high level of polymorphism among the treated accessions.
Table 4 shows the polymorphic information content of the studied accessions, ranging from 0.5025 to 0.9103. The gene diversity ranged from 0.5278 to 0.9167, indicating sufficient genetic diversity among the genotypes of the treated accessions. The phylogenetic tree showed the genetic relatedness of the accessions studied. RAPD markers indicated that the accessions were monophyletic. The morphological characteristics and seed colour variations of the studied accessions are illustrated in Plates 5 and 6.
Table 4. Genetic diversity and polymorphic information content.
Marker | Major.Allele.Frquency | Sample size | No. of obs. | Allele No | Availability | Gene diversity | PIC |
GENOTYPE | 0.0833 | 12.0000 | 12.0000 | 12.0000 | 1.0000 | 0.9167 | 0.9103 |
OPB04 | 0.6667 | 12.0000 | 12.0000 | 5.0000 | 1.0000 | 0.5278 | 0.5025 |
OPB17 | 0.5000 | 12.0000 | 12.0000 | 6.0000 | 1.0000 | 0.6944 | 0.6645 |
OPH05 | 0.4167 | 12.0000 | 12.0000 | 5.0000 | 1.0000 | 0.7222 | 0.6800 |
OPT05 | 0.3333 | 12.0000 | 12.0000 | 5.0000 | 1.0000 | 0.7361 | 0.69201 |
OPT07 | 0.4167 | 12.0000 | 12.0000 | 5.0000 | 1.0000 | 0.7222 | 0.6800 |
Mean | 0.4028 | 12.0000 | 12.0000 | 6.3333 | 1.0000 | 0.7199 | 0.6882 |

Plate 5. Vigna subterranea leaf, stem and seeds.

Plate 6. Vigna subterranea cream and brown color and seeds.
4. Discussion
EMS mutagenesis effectively generates genetic variability in Vigna subterranea (Bambara groundnut). Improved performance in the M2 generation indicates the stabilization of beneficial mutations, with moderate EMS doses (0.3–0.5%) enhancing yield traits without harming plant viability. The Brown variety outperformed Cream, consistent with [24], whereas higher EMS concentrations caused sterility and malformed pods [25, 26]. Yield parameters, including dry weight per seed (DWPS), 100-seed weight (DW), and yield per plant, increased in M2, supporting previous findings [27]. Genotype-specific responses to EMS reflect differences in DNA repair and stress tolerance [28-30].
RAPD analysis revealed substantial genetic variation among the treated accessions. The minor allele frequency ranged from 0.0833 (GENOTYPE) to 0.6667 (OPB04), and gene diversity ranged from 0.5278 (OPB04) to 0.9167 (GENOTYPE), exceeding untreated germplasm [31] and typical crop ranges [32]. PIC values (0.1527–0.5000) indicated moderate marker informativeness [33-35], with OPB17, OPH05, and OPT07 being the most informative.
RAPD markers revealed genetic variation among EMS-treated accessions, but are limited by dominant inheritance and poor reproducibility [15, 16]. Although cost-effective and useful for detecting mutation-induced variations [36, 37], they provide limited resolution. SSR and SNP markers offer higher accuracy, co-dominant inheritance, and broader genome coverage [38-44]. Their integration would improve genetic analysis and Bambara groundnut breeding. Distinct polymorphic banding patterns generated by different primers are illustrated in Plates 2–4, confirming the effectiveness of RAPD markers in detecting EMS-induced variation.
Genetic clustering showed two main clusters with sub-clusters, reflecting divergence among mutants while some remained similar to the controls [45, 31]. Selecting genotypes from both distant and parental clusters can maximize the identification of elite mutants [46, 47]. Phylogenetic analysis confirmed the EMS-induced genotypes were monophyletic but genetically differentiated, underscoring EMS as a tool for generating heritable variation and novel alleles for yield improvement, stress tolerance, and breeding [48-51].
5. Conclusions
These findings reinforce the effectiveness of EMS in enhancing genetic variability and highlight its value as a strategic tool in mutagenesis breeding programs. The alignment of our results with those of previous studies further confirms EMS as a reliable mutagen for broadening the genetic base of Vigna subterranea and improving key agronomic traits. Notably, the improved performance observed in the M2 generation, particularly in yield-related parameters, underscores the heritability of beneficial mutations. This supports the use of moderate EMS concentrations (0.3–0.5%) to induce stable and advantageous genetic changes. Future research incorporating advanced molecular markers and genomic tools could provide deeper insights into the genetic architecture of Vigna subterranea, ultimately facilitating its improvement and sustainable cultivation across diverse agro-ecological zones.
Disclaimer (artificial intelligence)
Author(s) hereby state that no generative AI tools such as Large Language Models (ChatGPT, Copilot, etc.) and text-to-image generators were utilized in the preparation or editing of this manuscript.
Authors’ contributions
Investigation, project administered, data curation, visualization and original draft preparation, N.N.N.; data curation, visualization, and original draft preparation, C.L.O.; suagwu, conceptualized, supervised, and validation, G.G.E.O.; performed the formal analysis, methodology and software, N.C.E. contributed to data curation, J.O.E.; assisted in investigation, F.E.A.; contributed to conceptualized, supervised, and methodology, G.O.; performed the formal analysis and methodology, B.N.U.
Acknowledgements
The authors don't have anything to acknowledge.
Funding
The authors received no financial support for the research, authorship, and/or publication of this article.
Availability of data and materials
All data will be made available on request according to the journal policy
Conflicts of interest
The authors affirm that there are no conflicts of interest, financial, academic, or personal associated with the preparation or publication of this paper. All authors contributed objectively and hold no competing interests.
References
|
1. |
Azam-Ali,
S.N.; Sesay, A.; Karikari, K.S.; Massawe, F.J.; Aguilar-Manjarrez, J.;
Bannayan, M.; Hampson, K.J. Assessing the potential of an underutilized
crop—A case study using Bambara groundnut. Exp. Agric. 2001, 37, 433–472.
https://doi.org/10.1017/S0014479701000412 |
|
2. |
Basu,
S.; Roberts, J.A.; Azam-Ali, S.N.; Mayes, S. Development of microsatellite
markers for Bambara groundnut (Vigna subterranea L. Verdc.). Mol. Ecol. Notes. 2007, 7(6),
1326–1328. https://doi.org/10.1111/j.1471-8286.2007.01870.x |
|
3. |
Massawe,
F.J.; Dickinson, M.; Roberts, J.A.; Azam-Ali, S.N. Genetic diversity in
Bambara groundnut landraces revealed by AFLP markers. Genome. 2002, 45(6), 1175–1180.
https://doi.org/10.1139/g02-093 |
|
4. |
Dakora,
F.D. Nodule function in symbiotic Bambara groundnut. Ann. Bot.
1998, 82, 687–690. https://doi.org/10.1006/anbo.1998.0739 |
|
5. |
Herridge,
D.F.; Peoples, M.B.; Boddey, R.M. Global inputs of biological nitrogen
fixation in agricultural systems. Plant
Soil. 2008, 311, 1–18.
https://doi.org/10.1007/s11104-008-9668-3 |
|
6. |
Hepper,
F.N. The Bambara groundnut and Kersting’s groundnut in West Africa. Kew Bull. 1963, 16, 395–407. https://doi.org/10.2307/4114356 |
|
7. |
Suwanprasert,
J.; Toojinda, T.; Srinives, P.; Chanprame, S. Hybridization technique of
Bambara groundnut. Breed. Sci. 2006, 56, 125–129. https://doi.org/10.1270/jsbbs.56.125 |
|
8. |
Pranesh,
E.; Nandini, R.; Chandra, K.; Nagaraju, N. Screening of Bambara groundnut
mutant lines. Int. J. Curr. Microbiol.
Appl. Sci. 2018, 7(4), 2872–2880.
https://doi.org/10.20546/ijcmas.2018.704.327 |
|
9. |
Boysen,
G.; Pachkowski, B.; Nakamura, J.; Swenberg, J. Biological significance of
N7-guanine adducts. Mutat. Res. 2009, 678, 76–94.
https://doi.org/10.1016/j.mrgentox.2009.05.006 |
|
10. |
Gillmor,
C.S.; Lukowitz, W. EMS mutagenesis of Arabidopsis seeds. In: Plant
Embryogenesis; Springer: pp.15–23, 2020.
https://doi.org/10.1007/978-1-0716-0342-0_2 |
|
11. |
Mba,
C.; Afza, R.; Bado, S.; Jain, S.M. Induced mutagenesis in plants. In: Plant
Cell Culture; Wiley: pp.111–130, 2010. https://doi.org/10.1002/9780470686522.ch7 |
|
12. |
Jain,
S.M. Mutagenesis in crop improvement under climate change. Rom. Biotechnol. Lett.
2010, 15(2), 88–106. |
|
13. |
Chen,
L.; Duan, L.; Sun, M.; Yang, Z.; Li, H.; Hu, K.; Yang, H.; Liu, L. EMS
mutagenesis in plant stress tolerance. Front.
Plant Sci. 2023, 13, 1052569.
https://doi.org/10.3389/fpls.2022.1052569 |
|
14. |
Unan,
R.; Deligoz, I.; Al-Khatib, K.; Mennan, H. EMS mutagenesis protocol in rice. Open Res. Eur.
2021, 1, 19. https://doi.org/10.12688/openreseurope.13317.1 |
|
15. |
Wilfinger,
W.W.; Krug, D.E.; Mackey, K. RNA integrity and RAPD standardization. Biotechniques. 1997, 22(6),
556–563. |
|
16. |
Perrier,
X.; Flori, A.; Bonnot, F. Data analysis methods in genetic diversity studies.
In: Genetic Diversity of Cultivated Tropical Plants. pp.43–76, 2003. |
|
17. |
Talebi,
A.B.; Talebi, A.B.; Shahrokhifar, B. EMS mutagenesis in rice. Am. J. Plant Sci. 2012, 3,
1661–1665. https://doi.org/10.4236/ajps.2012.312202 |
|
18. |
Sagel,
Z.; Tutluer, M.I.; Peskircioglu, H. EMS effects on soybean varieties. Ekin J. 2017, 3(1), 19–24. |
|
19. |
Omosun,
G.; Akanwa, F.E.; Lazarus, B. EMS effects on okra. Afr. Scientist, 2021, 22(2), 66-74. |
|
20. |
Ervin,
G.N.; Wetzel, R.G. Sodium hypochlorite sterilization effects. Wetlands 2002, 22, 191–195.
https://doi.org/10.1672/0277-12(2002)022 |
|
21. |
Sesay,
A. Bambara groundnut germination. Afr. J. Agric. Res. 2020, 15(2). |
|
22. |
Jain,
S.M.; Suprasanna, P. Induced mutations for food production. Geneconserve. 2011, 40, 201–215. |
|
23. |
Puchooa,
D. DNA extraction method. Afr. J.
Biotechnol. 2004, 3(4), 253–255. |
|
24. |
Henikoff,
S.; Comai, L. Single nucleotide mutations. Annu. Rev. Plant Biol. 2003, 54, 375–401.
https://doi.org/10.1146/annurev.arplant.54.031902.135009 |
|
25. |
Martin,
B.; Ramiro, M.; Martinez-Zapater, J.M.; Alonso-Blanco, C. EMS mutation
collection. BMC Plant Biol. 2009, 9, 147.
https://doi.org/10.1186/1471-2229-9-147 |
|
26. |
Thalari,
V.; Sarma, D.; Barua, P.K.; Sharma, K.K. EMS effects in pea. Legume Res. 2023. https://doi.org/10.18805/LR-5084 |
|
27. |
Chimdi,
G.O.; Uguru, M.I.; Ogbonna, P.E.; Onwubiko, N.C. EMS in Bambara groundnut.
IJTSRD 2022, 6(2), 934–942. |
|
28. |
Jankowicz-Cieslak,
J.; Bradley, J.T. EMS mutagenesis protocols. Curr. Protoc. Plant Biol. 2016, 1, 617–635. https://doi.org/10.1002/cppb.20040 |
|
29. |
Kumar,
A.; Kumar, V.; Lal, S.K.; Jolly, M.; Sachdev, A. EMS in soybean. J. Plant Biochem.
Biotechnol. 2015, 24, 204–209. |
|
30. |
Ali,
H.; Shah, T.M.; Iqbal, N.; Atta, B.M.; Haq, M.A. Chickpea mutation breeding. Plant Breed. 2010, 129, 116–119. |
|
31. |
Amadou,
H.I.; Bebeli, P.J.; Kaltsikes, P.J. Genetic diversity in Bambara groundnut (Vigna
subterranea L.) germplasm revealed by RAPD markers. Genome. 2001, 44(6), 995–999.
https://doi.org/10.1139/g01-096 |
|
32. |
Kanaka,
K.K.; Sukhija, N.; Goli, R.C.; Singh, S.; Ganguly, I.; Dixit, S.P.; Dash, A.;
Malik, A.A. On the concepts and measures of diversity in the genomics era.
Curr. Plant Biol. 2023, 33, 100278.
https://doi.org/10.1016/j.cpb.2023.100278 |
|
33. |
Botstein,
D.; White, R.L.; Skolnick, M.; Davis, R.W. Construction of a genetic linkage
map in man using restriction fragment length polymorphisms. Am. J. Hum. Genet. 1980, 32(3), 314–331. |
|
34. |
Serrote,
C.M.L.; Reiniger, L.R.S.; Silva, K.B.; Stefanel, C. Determining the
polymorphism information content of a molecular marker. Gene. 2019, 726, 144175.
https://doi.org/10.1016/j.gene.2019.144175 |
|
35. |
Varshney,
R.K.; Sinha, P.; Singh, V.K.; Kumar, A.; Zhang, Q.; Bennetzen, J.L. 5Gs for
crop genetic improvement. Curr.
Opin. Plant Biol.
2020, 56, 190–196. https://doi.org/10.1016/j.pbi.2020.04.001 |
|
36. |
Atienzar,
F.A.; Jha, A.N. The RAPD assay in genotoxicity studies. Mutat. Res. Rev.
2006, 613(2–3), 76–102. https://doi.org/10.1016/j.mrrev.2006.06.001 |
|
37. |
Weising,
K.; Nybom, H.; Wolff, K.; Kahl, G. DNA Fingerprinting in Plants; Taylor & Francis: 2005. |
|
38. |
Sambrook,
J.; Russell, D.W. Molecular Cloning: A Laboratory Manual; Cold Spring Harbor
Laboratory Press: 2001. |
|
39. |
Liu,
K.; Muse, S.V. PowerMarker: An integrated analysis environment for genetic
marker analysis. Bioinformatics.
2005, 21(9), 2128–2129. https://doi.org/10.1093/bioinformatics/bti282 |
|
40. |
Miah,
G.; Rafii, M.Y.; Ismail, M.R.; Puteh, A.B.; Rahim, H.A.; Islam, K.N.; Latif,
M.A. Microsatellite markers in crop breeding. Int. J. Mol. Sci.
2013, 14(11), 22499–22528. https://doi.org/10.3390/ijms141122499 |
|
41. |
Hendrix,
R.; Hauswaldt, S.; Veith, M.; Steinfartz, S. Microsatellite loci and genetic
distance. Mol. Ecol. Resour. 2010, 10(6), 1038–1047.
https://doi.org/10.1111/j.1755-0998.2010.02861.x |
|
42. |
Li,
X.; Qiao, L.; Chen, B.; Zheng, Y.; Zhi, C.; Zhang, S.; Pan, Y.; Cheng, Z. SSR
markers in garlic germplasm. Plant
Divers. 2022, 44(5), 481–491.
https://doi.org/10.1016/j.pld.2021.08.001 |
|
43. |
Zhang,
R.; Yao, F.; Cheng, X.; Yang, M.; Ning, Z. Genome-wide association study
analysis. BMC Genomics. 2023, 24, 110.
https://doi.org/10.1186/s12864-023-09222-0 |
|
44. |
Chen,
Q.; Ying, Q.H.; Lei, K.Z.; Zhang, J.M.; Liu, H.Z. Genetic markers in maize
breeding. Biosci. Methods. 2024, 15(5), 226–236.
https://doi.org/10.5376/bm.2024.15.0023 |
|
45. |
Sikora,
P.; Chawade, A.; Larsson, M.; Olsson, J.; Olsson, O. Mutagenesis in plant
genetics and breeding. Int. J. Plant Genomics.
2012, 2011, 314829. https://doi.org/10.1155/2011/314829 |
|
46. |
Pandey,
S.K.; Das, A.; Rai, P.; Dasgupta, T. Genetic diversity in sesame accessions. Physiol. Mol. Biol. Plants. 2015, 21(4), 519–529.
https://doi.org/10.1007/s12298-015-0322-2 |
|
47. |
Nazarul,
H.; Sana, C.M.; Jahan, N.S.; Neha, N. EMS-induced mutations in chilli. Res. Square. 2021. https://doi.org/10.21203/rs.3.rs-878724/v1 |
|
48. |
Varshney,
R.K.; Graner, A.; Sorrells, M.E. Genomics-assisted breeding. Trends Plant Sci.
2005, 10(12), 621–630. https://doi.org/10.1016/j.tplants.2005.10.004 |
|
49. |
Dossa,
K.; Yu, J.; Liao, B.; Cissé, N.; Zhang, X. Genome-wide SSR markers in sesame.
Front. Plant Sci. 2017, 8, 1470. https://doi.org/10.3389/fpls.2017.01470 |
|
50. |
Goddard,
K.A.B.; Hopkins, P.J.; Hall, J.M.; Witte, J.S. Linkage disequilibrium and SNP
variation. Am. J. Hum. Genet.
2000, 66(1), 216–234. https://doi.org/10.1086/302727 |
|
51. |
Rezaei,
N.; Hedayat, M. Allele frequency. In: Brenner’s Encyclopedia of Genetics;
Academic Press: pp.77–78, 2013.
https://doi.org/10.1016/B978-0-12-374984-0.00032-X |
This work is licensed under the
Creative Commons Attribution
4.0
License (CC BY-NC 4.0).
Abstract
Mutations
produce raw materials for the genetic improvement of economically important crops.
Genetic improvement of underutilized legumes requires the generation of novel
variability that exceeds the limitations of natural recombination. Vigna
subterranea (L.) Verdc., commonly known as Bambara groundnut, is valued for
its drought resilience and nutritional quality, yet breeding progress has been
slow due to its narrow genetic base and self-pollinating nature. This study
investigated the capacity of ethyl methanesulfonate (EMS) to induce heritable
variation and improve yield performance in two varieties, brown and cream.
Seeds were exposed to six EMS concentrations (0.00–0.5%) and evaluated across the
M1 and M2 generations using agronomic traits and RAPD-based molecular analysis.
The mutagen treatments generated substantial polymorphisms with polymorphic
information content values between 0.5025 and 0.9103 and gene diversity
estimates ranging from 0.5278 to 0.9167. Phylogenetic clustering separated the treated
lines into two principal groups with multiple sub-clusters, indicating a clear
genetic divergence from the untreated controls. Yield components responded
positively to moderate EMS doses. In M1, peak yields occurred at
0.3% for brown (129.33 g/plant) and 0.4% for cream (125.00 g/plant). Enhanced
performance was more evident in M2, where brown at 0.3% produced
138.67 g/plant and cream at 0.5% yielded 135.67 g/plant. Improvements in
100-seed dry weight, reaching 5.09 g, further demonstrated mutagen
effectiveness. The findings confirm that carefully optimized EMS application
can broaden the genetic base of Bambara groundnut and generate stable,
high-performing lines suitable for future breeding programs and adaptation to
diverse agro-ecological conditions.
Abstract Keywords
Vigna subterranea, EMS mutagenesis, genetic diversity, RAPD markers,
yield enhancement, molecular variation.
This work is licensed under the
Creative Commons Attribution
4.0
License (CC BY-NC 4.0).
Editor-in-Chief

This work is licensed under the
Creative Commons Attribution 4.0
License.(CC BY-NC 4.0).