

Research Article
Received: 2026-04-02 | Revised:2026-05-11 | Accepted: 2026-05-12 | Published: 2026-07-10
Pages: 178-192
DOI: https://doi.org/10.58985/jafsb.2026.v04i02.102
Abstract
The identification of Fusarium species associated with Fusarium
wilt of eggplant is an important step toward accurate diagnosis and management
of the disease. In this study, 32 Fusarium
isolates recovered from Fusarium wilt-infected eggplants in 15 communities
across the Ashanti, Eastern and Volta Regions of Ghana were identified and
characterized based on their morphological and molecular properties. Colony and
conidia characteristics were used to identify and characterise the isolates
morphologically. Genomic DNA of the Fusarium
isolates was extracted and the Internal Transcribed Spacer (ITS) primer (ITS1F)
and Translation Elongation Factor (TEF) primer (Fa-7_Ra-6F) were used to sequence the ITS and TEF
regions of the isolates’ DNA respectively.
Most of the Fusarium isolates were
morphologically identified as Fusarium
solani, F. oxysporum, or F. culmorum and
were confirmed by the ITS and TEF region sequences. Morphological characterisation
offers limited distinction among isolates of the same Fusarium species. Morphological characteristics, such as conidia
shape and size, appeared uniform for the Fusarium species, except for F. solani, which was grouped into two
based on sporodochia production. Both ITS and TEF region sequences could detect
differences among the Fusarium
isolates. However, there were differences in the phylogenetic grouping between
the ITS and TEF region sequences. The TEF sequence showed wider divergence in
the F. oxysporum and F. culmorum isolates but a close
relationship in the F. solani
isolates. Fusarium oxysporum isolates
were the most phylogenetically diverse.
Keywords
Fusarium species, eggplant, molecular identification, wilt, pathogen.
1. Introduction
The identification of species
within the Fusarium genus is an
important step in diagnosis disease and management. Morphological identification
of Fusarium species is mainly based on the distinctive characteristics of
the shapes and sizes of macro and micro conidia, colony appearances,
pigmentation and growth rates on agar media [12]. Morphological
identification of Fusarium species, although basic, is a difficult step
in the detection procedure [18].
Considerable expertise is required to distinguish between closely
related species. Morphological methods are time-consuming and have proven to be
limited and largely unable to identify differences within species. Molecular
techniques have been resourceful in confirming the morphological identification
of plant pathogens [18].
Nucleic acid (NA)-based techniques, especially those that
rely on polymerase chain reaction (PCR), have been identified to provide reliable
results in plant pathogen detection [21, 11].
According to [20], the diagnostic PCR method
was beneficial for the control of Fusarium wilt in strawberries because it
quickly determined the identity of the pathogen and could handle many samples
simultaneously. PCR-based methods are also rapid because pathogens do not need
to culture before identification. These methods are specific because
identification of the species is based on genotypic differences and are highly
sensitive, as target DNA molecules are detected in complex mixtures even when
the mycelia are no longer viable [3]. DNA
sequencing and species-specific polymerase chain reaction (PCR) assays are
recommended [22].
Sequences that have been valuable in distinguishing species
and origins of Fusarium include the
internal transcribed spacer (ITS) region from the conserved ribosomal RNA
genes, intergenic spacer (IGS), translation elongation factor, β-tubulin region,
and the mitochondrial small subunit (mtSSU) [19, 4,
15]. This sequence information has been widely used in the taxonomy and
phylogenetic studies of Fusarium species.
It provides sufficient resolution at the sub-species level, as this variability
is mainly harbored in the introns [19, 15].
The ITS region has been widely used as a barcode in fungal
community studies [13, 17]. However, ITS
markers do not provide species-level resolution for many Fusarium species that have non-orthologous copies of the ITS2
region [14]. Therefore, ITS markers are
limited for studying Fusarium
communities at the species level.
The translation elongation factor (TEF) gene is a useful phylogenetic marker for Fusarium, as it provides species-level discrimination [6]. TEF 1-α consistently presents as a single-copy gene in the Fusarium genus. This gene demonstrates a high level of sequence polymorphism among closely associated species of Fusarium, even compared with the intron-rich portions of protein-coding genes, such as β-tubulin, calmodulin and histone H3. TEF is a highly recommended marker as a single-locus detection tool in Fusarium [9, 6]. This study aimed to identify and characterize isolates of Fusarium wilt pathogens in eggplant using morphological characterize and PCR-based molecular methods with ITS and TEF primers.
2. Materials and methods
2.1. Sampling
of wilt-infected eggplants
The purposive sampling method was used to sample eggplant
farms with Fusarium wilt incidence. Farmers who reported wilt symptoms were contacted
and through a snowball (respondent-driven) sampling approach, other
wilt-infected eggplant farms were identified. Ten farms were selected in each
eggplant growing community for sampling of infected eggplants. Five communities
were sampled each from the Ashanti, Eastern and the Volta regions
of Ghana.
Ten plants were sampled from each farm visited: five plants
with visible symptoms of wilt and five with no visible wilt symptoms. The systematic
sampling method was as follows: starting at the third row in the left-hand
corner of the farm facing North, a plant was collected from any other row
towards the right-hand side until the 10 samples were collected. Whole plants
were uprooted together with some rhizosphere soil, excised at the stem base,
placed in a paper envelope, separately labelled and sent to the Plant Pathology
Laboratory of the Department of Crop and Soil Sciences, KNUST, Kumasi, Ghana.
The samples were air-dried on the laboratory bench at room temperature (25 ± 2 ⁰C) and later the rhizosphere soil and roots were examined
for Fusarium species.
2.2. Isolation
of Fusarium isolates
Infected eggplant roots were washed under running tap water to remove all soil and debris from the field and subjectively excised to 1.0 cm long and 0.5 cm wide pieces for each plant. The cut pieces were surface sterilized in 0.5% NaOCl for 3 min and in 75% ethanol for another 3 min, rinsed three times in sterile distilled water, and blotted dry. Root pieces were then plated on chloramphenicol (250 mg/L) amended Potato Dextrose Agar medium and incubated at (25 ±2 °C) for 7 days at 12 h photoperiod under fluorescent light.
Fusarium isolates were identified using a stereomicroscope at a magnification of X400 with the help of identification manuals [12, 7]. Single conidia culture of
Fusarium isolates was prepared by the following protocol described by [8]. A 7-day old single conidia culture of Fusarium isolates was used in this study.
2.3. Morphological
identification of Fusarium isolates
Each Fusarium isolate was examined microscopically and identified at the species level based on the morphological characteristics described by [7, 12]. Isolates were identified based on distinctive morphological characteristics such as the shape and size of macroconidia and microconidia the shape of the conidial apical and basal cells, the production and colour of sporodochia on Banana Leaf Agar, and the colony appearance, colour and pigment formation on PDA [7, 12].
2.4. Assessment
of cultural and morphological characteristics of Fusarium isolates
Mycelial plugs of 7-mm
diameter were taken from the growing margins of seven day-old single spore
cultures of Fusarium isolates with a sterile
cork borer. The plugs were placed separately at the centre of PDA in Petri
dishes and incubated at a temperature of 25 ± 2°C at the incubation
room. The cultural and morphological characteristics of mycelia on PDA were
assessed for 33 isolates of F. oxysporum, 45 isolates of F.
solani, and 11 isolates of F.
culmorum. The culture characteristics collected were mycelial growth,
mycelial colour, pigmentation, odour, presence of sporodochia, sporodochia
colour and thickness of mycelia, following the described procedure [12].
Two perpendicular lines
were marked with a ruler at the under-side of each 9 cm Petri dish to measure
the mycelial growth. Mycelial growth was
determined by measuring two colony diameters for each Fusarium isolate along the perpendicular lines with a ruler daily until
the Petri dish was fully covered with mycelia. The means of the two colony
diameters were computed for each isolate and used to determine the growth rate
of the Fusarium isolates.
Mycelial colour and pigment production in the agar were determined by observing the upper and lower surfaces of the Petri dishes, respectively after 14 days of incubation at a temperature of 25 ± 2°C. Mycelial odour was determined by smelling the mycelium after 14 days of incubation at 25 ± 2°C. Other characteristics such as sporodochia colour and thickness, were also assessed by observing the upper surface of the Petri dishes.
The morphological characteristics of macroconidia and microconidia were assessed after 21 days of inoculation of the Fusarium isolates on banana leaf agar at 25 ± 2°C. Macroconidia were assessed for size, shape, septation and apical and basal cell shapes. Microconidia were observed for abundance, size, and septation as the described method [12].
2.5.
Molecular characterization of Fusarium isolates
2.5.1.
Genomic DNA extraction
Total genomic DNA of the Fusarium isolates was extracted
separately from lyophilised seven-day old mycelia of single conidia cultures. A
modified CTAB-based protocol was used for DNA extraction. It was carried out at
the Molecular Biology Laboratory of the CSIR- Crops Research Institute, Kumasi,
Ghana. Mycelia were collected from the Petri dishes with a sterile glass rod
placed in liquid nitrogen in a 2.0 mL Eppendorf tube and ground into a fine
powder with a rod. Each tissue powder was mixed with 500 µL CTAB
extraction buffer [100 mm Tris-HCl
(pH 8), 1.4 m NaCl,
20 mm EDTA (pH 8), 2%
(w/v) CTAB, 2% w/v PVP, (0.1% v/v) β-mercaptoethanol, and homogenized by
vortexing. Each homogenate was incubated at 65 °C for 30 min
with intermittent vortexing.
After cooling to room
temperature, an equal volume of chloroform-isoamyl alcohol (24:1 v/v) was added
to the homogenate of each isolate followed by inversions of the tube to
ensure complete mixing. Each homogenate
was centrifuged at 13000 g for 15 min. Each aqueous phase
was hand-picked carefully without disturbing the middle layer and placed into a
labelled clean 2 ml tube. The resulted solution of each isolate was
re-extracted with chloroform-isoamyl alcohol (24:1). The DNA of each isolate
was precipitated at −20 °C overnight by addition of two-thirds volume of
ice-cold isopropanol. The DNA of each isolate was pelleted by centrifugation at
13000 g for
5 min followed by washing in 1 mL of 70% ethanol. Ethanol was
discarded, and each pellet was dried for 30 min. A 250 µL of 7.5M ammonium acetate was then
added to each pellet, mixed and incubated on ice for 5 min. Each sample was
then centrifuged at 13000 rpm for 10 min. The supernatant of each isolate was
transferred separately into a new tube, 700 µL of cold isopropanol was added,
and mixed by inversion and incubated at -20 °C for 1 h. Centrifugation at 13000
rpm for 10 min was carried out and the pellet of each isolate was washed with
80 % ethanol. It was then dried at 25±2 °C and re-suspended in
20 µl molecular grade water prior to use.
2.5.2.
Genomic DNA amplification and sequencing of the ITS
and TEF regions
Polymerase Chain Reaction was run using Promega GoTaq Green Master Mix (Functional Biosciences Inc., Madison, WI, USA) with a standard 3-step PCR protocol. The Sanger Sequencing protocol with Big Dye Terminator V3.1 was used to sequence the amplified PCR products. After Sanger cycling, the magnetic bead was used to clean-up and remove excess contaminants and dyes from the reaction. Finally, the cleaned-up product was injected into the ABI 3730XL sequencing analyzer. The primers used for the TEF regions were Fa-7_Ra-6F (AACGTCGTCGTCATCGGCCACGTCGACTCT; ACATACCAATGACGGTGACATAGTAG CG) and for the ITS regions, ITS1F (CTTGGTCATTTAGAGGAAGTAA) was used [10]. The Sanger Sequencing reactions were performed at the Functional Biosciences Inc. facility in Madison, Wisconsin, USA.
2.6. Experimental design and data analyses
A completely randomised design with three replicates per Fusarium isolate (treatment) was used in
this study. Mean differences in size of conidia and mycelial growth rate of the
isolates of different Fusarium
isolates were compared using honest significant difference (HSD) of 1% using
GenStat 12th edition, VSN International, UK. Qualitative data, such as mycelial
colour and shape of conidia were assessed visually and presented with
descriptive statistics.
The ITS and TEF region nucleotide sequences for the isolates were compared to the databases of the National Center for Biotechnology Information (NCBI; www.ncbi.nih.gov) using the Basic Local Alignment Search Tool for Nucleotide Sequences (BLASTN). Alignment of the ITS and TEF DNA sequences and phylogenetic trees of the sequences were created with the CLC Sequence Viewer Version 8 based on unweighted pair group method for arithmetic analysis (UPGMA).
3. Results
3.1. Morphological identification
The 32 Fusarium isolates were grouped into three species based on morphological identification. Fifteen isolates were Fusarium solani, 11 were Fusarium oxysporum and 6 were Fusarium culmorum (Table 1).
Table 1. Morphological identification of the Fusarium isolates from Ashanti, Eastern and Volta regions used.
Isolate code | Morphological identification | Source of isolates | Region |
A1 | Fusarium solani | Offinso | Ashanti |
A2 | F. solani | Nsuta | Ashanti |
A3 | F. solani | Juaso | Ashanti |
A4 | F. solani | Besoro | Ashanti |
A5 | F. solani | Abofour | Ashanti |
E1 | F. solani | Asiakwa | Eastern |
E2 | F. solani | Nkurakan | Eastern |
E3 | F. solani | Kwaho Praso | Eastern |
E4 | F. solani | Enyerisi | Eastern |
E5 | F. solani | Huhunya | Eastern |
V1 | F. solani | Yordan | Volta |
V2 | F. solani | Vapko | Volta |
V3 | F. solani | Aneta | Volta |
V4 | F. solani | Tafi | Volta |
V5 | F. solani | Have | Volta |
A6 | F. oxysporum | Nsuta | Ashanti |
A7 | F. oxysporum | Juaso | Ashanti |
A8 | F. oxysporum | Besoro | Ashanti |
E6 | F. oxysporum | Asiakwa | Eastern |
E7 | F. oxysporum | Nkurakan | Eastern |
E8 | F. oxysporum | Kwaho Praso | Eastern |
E9 | F. oxysporum | Enyerisi | Eastern |
E10 | F. oxysporum | Huhunya | Eastern |
V6 | F. oxysporum | Vapko | Volta |
V7 | F. oxysporum | Aneta | Volta |
V8 | F. oxysporum | Have | Volta |
A9 | F. culmorum | Offinso | Ashanti |
A10 | F. culmorum | Nsuta | Ashanti |
A11 | F. culmorum | Abofour | Ashanti |
E12 | F. culmorum | Kwaho Praso | Eastern |
V9 | F. culmorum | Vapko | Volta |
V10 | F. culmorum | Have | Volta |
3.2. Morphological characterisation of the Fusarium isolates
3.2.1 Fusarium solani isolates
Two morpho-types were identified in the F. solani isolates based on the presence of sporodochia in the cultures. The morpho-type A which included the isolates A1, E3, V1, V4 and V5 produced sporodochia that were yellow. Isolates with sporodochia also produced thin mycelia. The morpho-type B produced no sporodochia. Mycelial colour and pigment varied among the isolates (Table 2).
There were significant differences (P ≤ 0.01) in mycelial growth among the F. solani isolates. Mycelial growth was slowest in isolate A1 and fastest in isolate V1 (Table 2). Generally, the mycelial growth rate of the isolates was indicative of fast growth, which could aid in the quick distribution of the pathogen in the eggplant and the environment.
Table 2. Culture characteristics of Fusarium solani isolates from Ashanti, Eastern and Volta regions used.
Morpho-type | Fusarium solani codes | Mycelial colour | Pigment | Sporodochia | Sporodochia colour | Thickness of mycelium (µm) | Growth rate (cm/day) |
A | A1 | Light cream | Orange | Present | Yellow | Thin | 0.52 |
E3 | Light cream | Orange | Present | Yellow | Thin | 0.66 | |
V1 | Light cream | Orange | Present | Yellow | Thin | 1.13 | |
V4 | Creamy white | Brown | Present | Yellow | Thin | 0.82 | |
E5 | Cream | Brown | Present | Yellow | Thin | 0.97 | |
B | A2 | Light orange | Orange | Absent | - | Thick | 0.59 |
A3 | Creamy White | Orange | Absent | - | Thin | 0.71 | |
A4 | White | Light Orange | Absent | - | Thick | 0.49 | |
A5 | Light cream | Light Orange | Absent | - | Thick | 0.80 | |
E1 | Light pink | Brown | Absent | - | Thick | 0.94 | |
E2 | Light cream | Light Orange | Absent | - | Thick | 0.93 | |
E4 | Light orange | Orange | Absent | - | Thick | 0.77 | |
V5 | Creamy white | Orange | Absent | - | Thin | 0.85 | |
V2 | Light orange | Orange | Absent | - | Thick | 0.85 | |
V3 | Creamy white | Orange | Absent | - | Thin | 0.94 | |
HSD (0.01) | 0.09 | ||||||
CV (%) |
|
|
|
|
| 0.22 | |
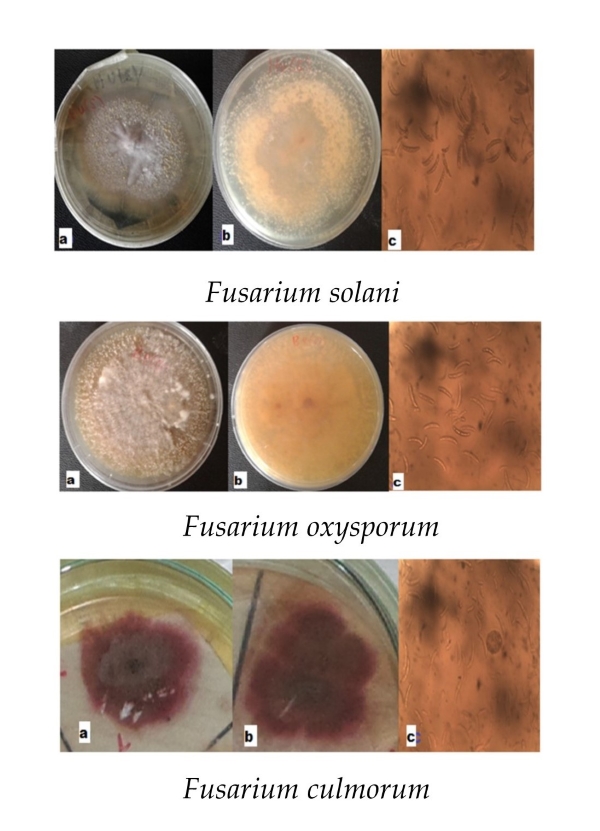
The shapes of the macroconidia and microconidia were uniform for all F. solani isolates. However, the number of septa in the macroconidia differed and ranged from two to four (Table 3; Plate 1). The dorsal part of the macroconidia was more curved than the ventral part, had a blunt apical end and barely had a notched basal end. The microconidia were oval and two-celled.
Table 3. Conidia characteristics of Fusarium solani isolates from Ashanti, Eastern and Volta regions used.
Fusarium solani code | Macroconidia | | Microconidia | ||
Shape | Apical | Basal | Septum | Shape | |
A1 | Dorsal more curved than Ventral | Blunt | Barely notched | 3 | Two-celled oval |
A2 | Dorsal more curved than Ventral | Blunt | Barely notched | 2 | Two-celled oval |
A3 | Dorsal more curved than Ventral | Blunt | Barely notched | 3 | Two-celled oval |
A4 | Dorsal more curved than Ventral | Blunt | Barely notched | 3 | Two-celled oval |
A5 | Dorsal more curved than Ventral | Blunt | Barely notched | 2 | Two-celled oval |
E1 | Dorsal more curved than Ventral | Blunt | Barely notched | 4 | Two-celled oval |
E2 | Dorsal more curved than Ventral | Blunt | Barely notched | 3 | Two-celled oval |
E3 | Dorsal more curved than Ventral | Blunt | Barely notched | 3 | Two-celled oval |
E4 | Dorsal more curved than Ventral | Blunt | Barely notched | 3 | Two-celled oval |
E5 | Dorsal more curved than Ventral | Blunt | Barely notched | 3 | Two-celled oval |
V1 | Dorsal more curved than Ventral | Blunt | Barely notched | 3 | Two-celled oval |
V2 | Dorsal more curved than Ventral | Blunt | Barely notched | 3 | Two-celled oval |
V3 | Dorsal more curved than Ventral | Blunt | Barely notched | 2 | Two-celled oval |
V4 | Dorsal more curved than Ventral | Blunt | Barely notched | 2 | Two-celled oval |
V5 | Dorsal more curved than Ventral | Blunt | Barely notched | 3 | Two-celled oval |

Plate 1. Fusarium solani: a. mycelia colour; b. pigment; c. macroconidia (x400)
Fusarium oxysporum Isolates.
The size of the conidia differed significantly (P ≤ 0.01) among the isolates. There were also significant (P ≤ 0.01) variations in conidia sizes among the isolate. The smallest and largest macroconidia were recorded in isolates E3 and V1, respectively (Table 4).
The culture characteristics that distinguished the F. oxysporum isolates were the colour of the mycelia and culture thickness. No sporodochium was produced by any of the isolates (Table 5).
Mycelial growth differed significantly (P ≤ 0.01) among the isolates. The slowest growth rate was recorded for isolate E6, whereas isolate V8 recorded the fastest rate (Table 5). The growth rates of the isolates were generally fast and could be useful for the prolific invasion of eggplants.
Table 4. Conidia size of Fusarium solani isolates from Ashanti, Eastern and Volta regions used.
Morpho type | Fusarium solani isolates | Macroconidia | Microconidia | ||
Mean length (µm) | Mean width (µm) | Mean length (µm) | Mean width (µm) | ||
A | A1 | 25.23 (23.90 - 26.60) | 3.43 (3.20 - 3.80) | 6.93 (6.30 - 7.70) | 3.13 (2.80 - 3.30) |
E3 | 16.13 (14.20 - 18.50) | 3.96 (3.80 - 4.20) | 6.00 (5.40 - 6.60) | 2.63 (2.30 - 3.30) | |
V1 | 23.46 (22.60 - 24.50) | 5.00 (4.20 - 5.80) | 8.86 (8.20 - 9.20) | 3.06 (2.60 - 3.70) | |
V4 | 25.53 (24.60 - 27.10) | 4.63 (3.40 - 5.70) | 6.83 (6.50 - 7.40) | 3.80 (3.4 - 4.00) | |
E5 | 24.93 (24.00 - 25.70) | 5.16 (4.70 - 5.50) | 4.73 (4.40 - 5.20) | 2.53 (2.4 - 2.6) | |
B | A2 | 25.56 (25.00 - 26.10) | 4.40 (3.90 - 4.90) | 6.93 (6.20 - 7.90) | 4.46 (4.40 - 4.60) |
A3 | 25.63 (23.00 - 28.00) | 3.93 (3.60 - 4.10) | 11.83 (11.30 - 12.80) | 3.33 (2.90 - 3.70) | |
A4 | 23.10 (22.80 - 23.30) | 4.13 (4.10 - 4.20) | 9.63 (9.00 - 10.30) | 4.13 (4.00 - 4.40) | |
A5 | 18.50 (17.80 - 19.00) | 4.26 (3.60 - 5.20) | 6.63 (6.30 - 7.10) | 2.93 (2.80 - 3.00) | |
E1 | 22.70 (21.80 - 23.60) | 4.86 (4.30 - 5.40) | 8.86 (8.40 - 9.60) | 3.23 (2.80 - 3.60) | |
E2 | 24.30 (20.60 - 26.70) | 5.43 (4.90 - 5.80) | 7.66 (7.00 - 8.60) | 2.76 (2.10 - 3.10) | |
E4 | 23.93 (21.80 - 27.6) | 5.16 (5.00 - 5.50) | 11.73 (10.00 - 13.00) | 3.76 (3.30 - 4.20) | |
V5 | 25.60 (24.60 - 25.70) | 4.40 (3.80 - 4.80) | 12.76 (12.00 - 13.50) | 4.60 (4.20 - 4.80) | |
V2 | 21.80 (19.60 - 23.80) | 4.60 (4.30 - 5.00) | 9.06 (8.40 - 9.80) | 3.06 (2.80 - 3.20) | |
V3 | 23.96 (22.60 - 25.60) | 4.23 (4.10 - 4.50) | 7.03 (6.50 - 7.60) | 4.03 (3.50 - 4.30) | |
HSD (0.01) | 1.52 | 0.3 | 1.28 | 0.36 | |
| CV (%) | 0.11 | 0.12 | 0.27 | 0.19 |
The values in parenthesis ( ) are the minimum and maximum conidial measurements. | |||||
Table 5. Culture characteristics of Fusarium oxysporum isolates from Ashanti, Eastern and Volta regions used.
Fusarium oxysporum isolates | Mycelial colour | Pigment | Thickness of mycelium (µm) | Growth rate (cm/day) |
A6 | White | Orange | Thick | 0.97 |
A7 | Light orange | Orange | Thick | 0.87 |
A8 | Whitish orange | Orange | Thin | 0.85 |
E6 | Whitish orange | Orange | Thick | 0.63 |
E7 | Whitish orange | Orange | Thin | 0.71 |
E8 | White | Brown | Thick | 0.91 |
E9 | Orange | Brown | Thin | 0.68 |
E10 | Light pink | Pink | Thick | 0.72 |
V6 | Light pinkish white | Deep Brown | Thick | 1.30 |
V7 | Whitish orange | Orange | Thick | 1.01 |
V8 | Light pink | Red | Thick | 1.08 |
HSD (0.01) |
|
|
| 0.13 |
CV (%) |
|
|
| 0.23 |
The shapes of the macroconidia and microconidia were similar for all Fusarium oxysporum isolates. The number of septa in the macroconidia, however, differed and ranged from three to five (Table 6). The macroconidia were slender shaped with a hooked apical end and a distinctly notched basal end (Plate 2). The microconidia were all reniform shaped.
Table 6. Conidia characteristics of Fusarium oxysporum isolates from Ashanti, Eastern and Volta regions used.
Fusarium oxysporum isolate (code) | Macroconidia | Microconidia | |||
Shape | Apical | Basal | Septum | Shape | |
A6 | Slender | Hooked | Distinctly notched | 5 | Reniform |
A7 | Slender | Hooked | Distinctly notched | 3 | Reniform |
A8 | Slender | Hooked | Distinctly notched | 4 | Reniform |
E6 | Slender | Hooked | Distinctly notched | 4 | Reniform |
E7 | Slender | Hooked | Distinctly notched | 4 | Reniform |
E8 | Slender | Hooked | Distinctly notched | 3 | Reniform |
E9 | Slender | Hooked | Distinctly notched | 5 | Reniform |
E10 | Slender | Hooked | Distinctly notched | 3 | Reniform |
V6 | Slender | Hooked | Distinctly notched | 3 | Reniform |
V7 | Slender | Hooked | Distinctly notched | 5 | Reniform |
V8 | Slender | Hooked | Distinctly notched | 3 | Reniform |

Plate 2. Fusarium oxysporum: a. mycelia colour; b. pigment; c. macroconidia (x400).
Conidia size differed significantly (P ≤ 0.01) between the isolates. There were also significant variations in the conidia size for each isolate. The smallest and biggest macroconidia were recorded in isolates E7 and E10, respectively (Table 7).
Table 7. Conidia size of Fusarium oxysporum isolates from Ashanti, Eastern and Volta regions used.
Fusarium oxysporum isolates (code) | Macroconidia | Microconidia | ||
Mean length (µm) | Mean width (µm) | Mean length (µm) | Mean width (µm) | |
A6 | 25.13 (25.00 - 25.40) | 4.00 (3.70 - 4.30) | 8.83 (8.50 - 9.40) | 3.56 (3.50 - 3.60) |
A7 | 19.53 (17.70 - 22.00) | 3.16 (2.80 - 3.70) | 13.76 (12.80 - 14.40) | 3.96 (3.20 - 4.40) |
A8 | 24.33 (22.70 - 28.40) | 4.50 (3.50 - 5.60) | 7.83 ( 7.80 - 7.90) | 5.26 (5.20 - 5.40) |
E6 | 19.96 (18.40 - 21.50) | 3.80 (3.20 - 4.20) | 4.50 (4.20 - 4.70) | 2.46 (2.20 - 2.60) |
E7 | 16.33 (15.90 - 16.90) | 2.7 (2.60 - 2.90) | 8.86 (8.50 - 9.30) | 3.23 (3.10 - 3.50) |
E8 | 25.20 (24.30 - 26.70) | 4.36 (4.00 - 4.70) | 10.46 (9.30 - 11.70) | 4.23 (4.00 - 44.00) |
E9 | 17.73 (17.10 - 18.30) | 3.56 (3.30 - 3.80) | 7.20 (6.40 - 7.90) | 2.93 (2.60 - 3.20) |
E10 | 27.86 (27.10 - 28.50) | 4.86 (4.70 - 5.00) | 12.90 (12.20 - 13.40) | 4.46 (3.70 - 5.40) |
V6 | 26.96 (25.30 - 27.90) | 4.30 (4.10 - 4.50) | 7.70 (6.30 - 8.60) | 3.36 (3.20 - 3.70) |
V7 | 22.93 (18.60 - 28.00) | 3.93 (3.10 - 4.7) | 12.00 (11.9 - 12.3) | 4.63 (4.50 - 4.70) |
V8 | 26.83 (25.50 - 28.50) | 4.53 (4.30 - 4.90) | 10.43 (8.50 - 11.50) | 4.26 (4.20 - 4.40) |
HSD (0.01) | 2.67 | 0.42 | 1.83 | 0.55 |
CV (%) | 0.17 | 0.15 | 0.28 | 0.21 |
The values in parenthesis ( ) are the minimum and maximum conidial measurements. | ||||
3.2.2. Fusarium culmorum isolates
The culture characteristic that distinguished the F. culmorum isolates was the mycelial thickness. No sporodochium was produced by any of the isolates (Table 8). Mycelial growth differed significantly (P ≤ 0.01) among the isolates. The slowest growth rate was recorded for isolate A11, whereas, isolate E11 recorded the fastest rate (Table 8). The growth rates of the isolates were generally moderate, except for isolate KPFC, which was fast-growing. The moderate growth rate of the isolates could have resulted in slower infection and disease progression, compared to isolates of Fusarium solani and Fusarium oxysporum that comparatively grew faster.
Table 8. Culture characteristics of Fusarium culmorum isolates from Ashanti, Eastern and Volta regions used.
Fusarium culmorum isolates (code) | Mycelial colour | Pigment | Thickness of mycelium(µm) | Growth rate (cm/day) |
A9 | Pink | Red | Thick | 0.69a |
A10 | Pink | Red | Thick | 0.68a |
A11 | Pink | Red | Thin | 0.63a |
E11 | Pink | Dark red | Thin | 1.26b |
V9 | Red | Red | Thin | 0.64a |
V10 | Dark pink | Reddish Brown | Thin | 0.75a |
HSD (0.01) |
|
|
| 0.25 |
CV (%) |
|
|
| 0.31 |
The shapes of the macroconidia were similar for all F. culmorum isolates. The number of septa in the macroconidia, however, differed and ranged from three to four (Table 9). The dorsal part of the macroconidia was more curved than the ventral part and had a blunt apical end and barely notched basal end.
The size of the macroconidia differed significantly (P ≤ 0.01) between the isolates. There were also significant variations in conidia size for each isolate. The smallest and biggest macroconidia were recorded in isolates V10 and A9, respectively (Table 10; Plate 3).
Table 9. Conidia characteristics of Fusarium culmorum isolates from Ashanti, Eastern and Volta regions used.
Fusarium culmorum isolate | Macroconidia | |||
Shape | Apical | Basal | Septum | |
A9 | dorsal side more curved than ventral side | Blunt | Barely notched | 4 |
A10 | dorsal side more curved than ventral side | Blunt | Barely notched | 3 |
A11 | dorsal side more curved than ventral side | Blunt | Barely notched | 3 |
E11 | dorsal side more curved than ventral side | Blunt | Barely notched | 3 |
V9 | dorsal side more curved than ventral side | Blunt | Barely notched | 3 |
V10 | dorsal side more curved than ventral side | Blunt | Barely notched | 3 |
Table 10. Conidia size of Fusarium culmorum isolates from Ashanti, Eastern and Volta regions used.
Fusarium culmorum isolate (code) | Macroconidia | |
Mean length (µm) | Mean width(µm) | |
A9 | 30.53 (25.80 - 33.80) | 4.46 (3.90 - 5.10) |
A10 | 23.66 (21.20 - 26.50) | 4.03 (3.80 - 4.20) |
A11 | 22.50 (22.10 - 23.20) | 4.76 (4.70 - 4.90) |
E11 | 24.8 (22.90 - 28.20) | 4.40 (4.20 - 5.00) |
V9 | 24.26 (23.70 - 25.2) | 4.46 (3.90 - 5.00) |
V10 | 19.86 (14.50 - 23.20) | 4.46 (3.20 - 5.20) |
HSD (0.01) | 3.30 | 0.24 |
CV (%) | 0.14 | 0.05 |
The values in parenthesis () are the minimum and maximum conidial measurements. | ||

Plate 3. Fusarium culmorum: a. mycelia colour; b. pigment; c. macroconidia (x400).
3.3. Molecular identification of Fusarium isolates with ITS primer
3.3.1. Fusarium solani isolates
Fifteen of the Fusarium isolates were identified as F. solani with the ITS1 primer when the DNA sequence was compared with the NCBI database using the BLASTN. The F. solani isolates differed in the number of base-pairs (bp) amplified in the ITS regions of the genomic DNA. The amplified region ranged from 324 to 446 bp (Table 11). The identification of ITS1F in the F. solani isolates, confirmed the morphological identification.
Table 11. Identification of Fusarium solani isolates using ITS (ITS1F).
Fusarium isolate code | ITS identification | No. bp | Accuracy (%) | GeneBank accession No. |
A1 | F. solani | 325 | 100.00 | ON899848.1 |
A2 | F. solani | 325 | 99.70 | ON890821.1 |
A3 | F. solani | 446 | 100.00 | ON899848.1 |
A4 | F. solani | 327 | 100.00 | |
A5 | F. solani | 330 | 100.00 | ON738704.1 |
E1 | F. solani | 325 | 99.34 | MN173143.1 |
E2 | F. solani | 324 | 99.70 | MH890688.1 |
E3 | F. solani | 326 | 100.00 | ON899842.1 |
E4 | F. solani | 446 | 99.31 | ON899848.1 |
E5 | F. solani | 325 | 99.70 | ON899848.1 |
V1 | F. solani | 324 | 99.70 | MN173137.1 |
V2 | F. solani | 324 | 100 | ON899848.1 |
V3 | F. solani | 332 | 100 | ON899848.1 |
V4 | F. solani | 330 | 100 | ON899848.1 |
V5 | F. solani | 329 | 100 | ON745555.1 |
The phylogenetic tree of F. solani isolates consisted of two main clusters. Cluster I comprised two isolates (A1 and A2) and Cluster II comprised E5 and sub-clusters, as presented in (Fig. 1). The clustering pattern of the F. solani isolates indicated relatedness, except for the two main clusters, which showed wide variation.

Figure 1. ITS phylogenetic tree of Fusarium solani isolates.
3.3.2. Fusarium oxysporum isolates
Eleven of the Fusarium isolates were identified as F. oxysporum the ITS1 primer when the DNA sequence was compared with the NCBI database using the BLASTN. The F. oxysporum isolates differed in the number of base-pairs (bp) amplified in the ITS regions of the genomic DNA. The amplified region ranged from 322 to 332 bp (Table 12). The identification of ITS1F in the F. oxysporum isolates confirmed morphological identification.
Table 12. Identification of Fusarium oxysporum isolates using ITS (ITS1F).
Fusarium isolate code | ITS identification | No. bp | Accuracy (%) | GeneBank accession No. |
A6 | F. oxysporum | 326 | 100.00 | ON890821.1 |
A7 | F. oxysporum | 326 | 100.00 | OM406348.1 |
A8 | F. oxysporum | 325 | 100.00 | ON668120.1 |
E6 | F. oxysporum | 330 | 100.00 | OM406348.1 |
E7 | F. oxysporum | 325 | 100.00 | ON117317.1 |
E8 | F. oxysporum | 328 | 100.00 | ON803511.1 |
E9 | F. oxysporum | 328 | 99.70 | ON890821.1 |
E10 | F. oxysporum | 322 | 100.00 | OM956392.1 |
V6 | F. oxysporum | 328 | 100.00 | ON890820.1 |
V7 | F. oxysporum | 332 | 95.71 | ON890820.1 |
V8 | F. oxysporum | 327 | 99.70 | ON803511.1 |
The phylogenetic tree of F. oxysporum isolates consisted of two main clusters (Fig. 2). Cluster I comprised isolate E10, and Cluster II comprised two sub-clusters: Cluster II A, which comprised (A7 and E6) and Cluster II B, which comprised isolate V6 and other sub-clusters (Fig. 2). The clustering pattern of the F. oxysporum isolates indicated close relatedness of the majority of the isolates in Cluster II, except for isolates E8, E9 and V7, which had wide variation.

Figure 2. ITS phylogenetic tree of Fusarium oxysporum isolates.
3.3.4. Fusarium culmorum isolates
Six of the Fusarium isolates were identified as F. culmorum using the ITS1 primer when the DNA sequence was compared with the NCBI database using BLASTN. The F. culmorum isolates differed in the number of base-pairs (bp) amplified in the ITS regions of the genomic DNA. The amplified regions ranged from 308 to 657 bp (Table 13). The identification of ITS1F in the F. culmorum isolates confirmed morphological identification.
Table 13. Identification of Fusarium culmorum isolates using ITS (ITS1F).
Fusarium isolate code | ITS identification | No. bp | Accuracy (%) | GeneBank accession No. |
A9 | F. culmorum | 325 | 100.00 | MW898129.1 |
A10 | F. culmorum | 308 | 99.70 | ON117408.1 |
A11 | F. culmorum | 324 | 99.70 | ON117408.1 |
E11 | F. culmorum | 657 | 99.31 | ON117409.1 |
V9 | F. culmorum | 331 | 100.00 | OL699879.1 |
V10 | F. culmorum | 322 | 100.00 | MW898129.1 |
The phylogenetic tree of Fusarium culmorum isolates consisted of two main clusters. Cluster I (isolates E11 and V10), Cluster II.: Cluster II comprised two sub-clusters, Cluster II A (isolates V9 and A10) and Cluster II B (isolates A11 and A9) as illustrated in (Fig. 3). The clustering pattern indicated a wide variation in the F. culmorum isolates.

Figure 3. ITS phylogenetic tree of Fusarium culmorum isolates.
3.4. Molecular identification of Fusarium isolates with TEF primer
3.4.1. Fusarium solani isolates
Fifteen of the Fusarium isolates were identified as F. solani using the TEF primer (Fa-7_Ra-6F) when the DNA sequence was compared with the NCBI database using BLASTN. The F. solani isolates differed in the number of base-pairs (bp) amplified in the TEF regions of the genomic DNA. The amplified region ranged from 571 to 590 bp (Table 14). The TEF identification of the Fusarium solani isolates confirmed the morphological identification.
Table 14. Identification of Fusarium solani isolates using TEF (Fa-7_Ra-6F).
Fusarium isolate code | TEF identification | No. bp | Accuracy (%) | GeneBank accession No. |
A1 | F. solani | 581 | 100.00 | DQ247396.1 |
A2 | F. solani | 580 | 99.81 | MN689879.1 |
A3 | F. solani | 584 | 100.00 | DQ247396.1 |
A4 | F. solani | 577 | 100.00 | LN828007.1 |
A5 | F. solani | 579 | 100.00 | DQ247396.1 |
E1 | F. solani | 590 | 100.00 | MN0689879.1 |
E2 | F. solani | 571 | 95.96 | HE647945.1 |
E3 | F. solani | 587 | 99.64 | DQ247396.1 |
E4 | F. solani | 576 | 100.00 | DQ247396.1 |
E5 | F. solani | 581 | 100.00 | DQ247396.1 |
V1 | F. solani | 580 | 99.82 | DQ247396.1 |
V2 | F. solani | 582 | 99.64 | MF327659.1 |
V3 | F. solani | 584 | 99.64 | MF327650.1 |
V4 | F. solani | 576 | 99.81 | MN689879.1 |
V5 | F. solani | 584 | 99.81 | KY586223.1 |
The phylogenetic tree of F. solani isolates consisted of two main clusters. Cluster I had two sub-clusters and Cluster II comprised two sub-clusters, as presented in Fig. 4. The clustering pattern of the F. solani isolates indicated a close relationship between the isolates in clusters I and II. However, isolate A4 in cluster II was very diverse from the other isolates in the cluster.

Figure 4. TEF phylogenetic tree of Fusarium solani isolates.
3.4.2. Fusarium oxysporum isolates
Eleven of the Fusarium isolates were identified as F. oxysporum using the TEF primer (Fa-7_Ra-6F) when the DNA sequence was compared with the NCBI database using BLASTN. The F. oxysporum isolates differed in the number of base-pairs (bp) amplified in the TEF regions of the genomic DNA. The amplified region ranged from 548 to 592 bp (Table 15). The TEF identification of the Fusarium oxysporum isolates confirmed the morphological identification.
The phylogenetic tree of F. oxysporum isolates consisted of two main clusters (Fig. 5). Cluster I comprised E9 and E7 isolates. Cluster II was divergent, with wide variations in the component isolates, as illustrated in (Fig. 5). The clustering pattern of the F. oxysporum isolates indicated wide variations the among isolates.
Table 15. Identification of Fusarium oxysporum isolates using TEF (Fa-7_Ra-6F).
Molecular isolate code | TEF identification | No. bp | Accuracy (%) | GeneBank accession no.(sequence ID) |
A6 | F. oxysporum | 592 | 99.82 | OK631814.1 |
A7 | F. oxysporum | 587 | 100.00 | MN689879.1 |
A8 | F. oxysporum | 548 | 99.81 | MG733183.1 |
E6 | F. oxysporum | 572 | 99.81 | MG733183.1 |
E7 | F. oxysporum | 574 | 100.00 | MN689879.1 |
E8 | F. oxysporum | 580 | 100.00 | MG733183.1 |
E9 | F. oxysporum | 580 | 99.81 | MG733183.1 |
E10 | F. oxysporum | 570 | 99.82 | OK631814.1 |
V6 | F. oxysporum | 578 | 99.63 | MK752504.1 |
V7 | F. oxysporum | 583 | 99.63 | MT5766471 |
V8 | F. oxysporum | 581 | 100.00 | MN411314.1 |

Figure 5. TEF phylogenetic tree of Fusarium oxysporum isolates.
3.4.3. Fusarium culmorum isolates
Six of the Fusarium isolates were identified as F. culmorum using the TEF primer (Fa-7_Ra-6F) when the DNA sequence was compared with the NCBI database using the BLASTN. The Fusarium culmorum isolates differed in the number of base-pairs (bp) amplified in the TEF regions of the genomic DNA. The amplified region ranged from 577 to 585 bp (Table 16). The TEF identification of the F. culmorum isolates confirmed their morphological identification.
The phylogenetic tree of F. culmorum isolates consisted of two main clusters. Cluster I comprised closely related isolates A10 and V9. Cluster II showed wide variations in the isolates, as shown in Fig. 6. The clustering pattern of F. culmorum isolates indicated wide variations among the isolates.
Table 16. Identification of Fusarium culmorum isolates using TEF (Fa-7_Ra-6F).
Fusarium isolate code | TEF identification | No. bp | Accuracy (%) | GeneBank accession No. |
A9 | F. culmorum | 579 | 99.82 | MG733183.1 |
A10 | F. culmorum | 585 | 92.40 | MF974551.1 |
A11 | F. culmorum | 580 | 99.82 | MG733183.1 |
E11 | F. culmorum | 583 | 99.82 | MG733183.1 |
V9 | F. culmorum | 582 | 99.62 | KM401894.1 |
V10 | F. culmorum | 577 | 92.40 | MF974551.1 |

Figure 6. TEF phylogenetic tree of Fusarium culmorum isolates.
4. Discussion
This study reports the morphological and molecular phylogenetic characteristics of Fusarium wilt pathogens of eggplant isolated from 15 major growing communities across the Ashanti, Eastern and Volta Regions of Ghana. Thirty-two Fusarium isolates recovered from Fusarium wilt infected eggplants were morphologically identified as three species. Fifteen of the isolates were F. solani, 11 were F. oxysporum and 6 were F. culmorum. The F. solani isolates were divergent in cultural appearance and were primarily distinguished by the presence of sporodochia and secondarily by the mycelial colour and pigmentation. Conidial characteristics did not show any significant variations among the F. solani isolates. There were significant differences in the growth rate as well as conidia size among the F. solani isolates. The internal transcribed spacer (ITS) region sequences showed differences within the F. solani isolates, as depicted by morphological characterisation. However, the translation elongation factor (TEF) region sequences showed close relatedness in most F. solani isolates.
The F. oxysporum isolates were mostly uniform in mycelial colour, pigmentation and conidial characteristics. The sources of variation among the F. oxysporum isolates were growth rate and conidia size. Variations in the ITS region sequences were similar to those in TEF region sequences. The F. oxysporum isolates were divergent at the molecular level but uniform at the morphological level.
The F. culmorum isolates were uniform in mycelial colour, pigmentation and conidial characteristics. The growth rates and conidia sizes were also not significantly different among the isolates. However, molecular characterisation showed significant variations in the F. culmorum isolates. The divergence between the TEF region sequences was greater than that between the ITS region sequences. The TEF primer was more efficient in identifying differences among the F. culmorum isolates.
Morphological characterization offers limited distinction among isolates of the same Fusarium species. Differences in conidia size were unreliable due to the wide range of conidia sizes. Growth rate is not a good parameter for differentiation because it can be influenced by factors such as poor culture and growth medium. According to [18], many morphological features used for Fusarium species identification are unstable and provide false estimates. In phylogenetically diverse fungi such as Fusarium [3], morphological identification should be limited to the genus level, although some species can be easily identified morphologically with selective media and experience [18].
Fusarium identification based on the ITS region sequence has been widely used. In this study, the ITS region sequence distinctly identified Fusarium species and their variations within the species. The credibility of the ITS region sequence in the identification of Fusarium has been challenged [16], who reported that DNA sequences of the ITS regions were uninformative for Fusarium, although they are useful in distinguishing species in many eukaryotic organisms. O'Donnell et al. [16] observed a wide divergence in Fusarium sequences with different ITS primers. According to the previous reports [1, 5], the ITS region represents a small portion of the total genome; therefore, other segments of the genome must be studied to ascertain the true structure of the genome of the organism being investigated. Singha et al. [18] further argued that segments of the ITS regions of Fusarium species are non-orthologous. Therefore, ITS regions are limited in the phylogenetic analysis of Fusarium species.
According to [22, 10, 6, 3], the TEF gene is a useful phylogenetic marker for Fusarium, as it consistently presents a single-copy gene in the Fusarium genus, which provides species-level discrimination. In the present study, the TEF primer produced a larger genome sequence of the Fusarium isolates which identified more interrelations among the Fusarium isolates. Fusarium solani isolates were identified as closely related by the TEF sequence compared to the ITS sequence, which showed wide divergence. The phylogenetic grouping of the TEF sequences of the F. oxysporum isolates was differed from that of the ITS sequence grouping. The TEF sequence showed a wider divergence in F. oxysporum isolates. The phylogenetic grouping of the TEF sequence of the F. culmorum isolates was also different from that of the ITS sequence grouping, with the later showing wider divergence among the isolates.
5. Conclusions
Most of the Fusarium wilt pathogens of eggplant in Ghana were morphologically and molecularly identified as three Fusarium species, namely F. solani, F. oxysporum and F. culmorum. Morphological characteristics were largely uniform within the Fusarium species. However, clear distinctions were identified by the molecular characterisation. Both ITS and TEF region sequences could detect differences among the Fusarium isolates. However, there were differences in the phylogenetic grouping between the ITS and TEF region sequences. Fusarium oxysporum isolates were the most phylogenetically diverse.
Disclaimer (artificial intelligence)
Author(s) hereby state that no generative AI tools such as Large Language Models (ChatGPT, Copilot, etc.) and text-to-image generators were utilized in the preparation or editing of this manuscript.
Authors’ contributions
Visualization, methodology, writing– original draft, E.O.O.; writing – review & editing, C.K.K., E. O.; protocol writing, R.P., E.A.A.
Acknowledgements
The authors would like to thank the CSIR-Crops Research Institute, Ghana and the Kwame Nkrumah University of Science and Technology Kumasi, Ghana for providing laboratory and technical support for this research.
Funding
The Council for Scientific and Industrial Research – Plant Genetic Resources Research Institute Ghana, is acknowledged for financial support.
Availability of data and materials
All data will be made available on request according to the journal policy.
Conflicts of interest
The authors declare no conflicting interest.
References
|
1. |
Abang, M.M.; Winter, S.; Mignouna, H.D.;
Green, K.R.; Asiedu, R. Molecular taxonomic, epidemiological and population
genetic approaches to understanding yam anthracnose disease. Afri. J. Biotechnol. 2004,
2, 486-496.
https://doi.org/10.5897/ajb2003.000-1098 |
|
2. |
Arif, M.; Pani, D.R.;
Zaidi, N.W.; Singh, U.S. PCR-based identification and characterization of Fusarium sp. associated with mango
malformation. Biotechnol. Res. Int. 2011. https://doi:10.4061/2011/141649 |
|
3. |
Arif, M.; Chawla, S.;
Zaidi, M.W.; Rayar, J.K.; Variar, M.; Singh, U.S. Development of specific
primers for genus Fusarium and F. solani using rDNA sub-unit and
transcription elongation factor (TEF-1α) gene. Afri. J. Biotechnol. 2012, 11(2), 444-447. https://doi.org/10.5897/ajb10.489 |
|
4. |
Baayen, R.P.; O'Donnell, K.; Bonants,
P.J.; Cigelnik, E.; Kroon, L.P.; Roebroeck, E.J.; Waalwijk, C. Gene
genealogies and AFLP analyses in the Fusarium
oxysporum complex identify monophyletic and nonmonophyletic formae
speciales causing wilt and rot disease. Phytopathol. 2000, 90(8), 891-900.
https://doi.org/10.1094/phyto.2000.90.8.891 |
|
5. |
Cunnington, J.H.; Lawawrie, A.C.;
Pasco, I.G. Unexpected ribosomal DNA internal transcribed spacer sequence
variation with Erysiphe aquilegiae sensu lato. Fung. Divers. 2004, 16, 1-10. https://doi.org/10.7717/peerj.5132/supp-4 |
|
6. |
Geiser, D.M.; María del Mar, J.G.;
Seogchan, K.; Izabela, M.; Narayanan, V.; Todd, J.W.; Ning, Z.; Gretchen, A.
K.; Kerry, O. "FUSARIUM-ID v. 1.0: A DNA sequence database for
identifying Fusarium." Eur. J. Plt. Pathol. 2004, 110(5), 473-479.
https://doi.org/10.1023/b:ejpp.0000032386.75915.a0 |
|
7. |
Ghoneem,
K.M.; Elwakil, M.A.; Ismail, A.E. Puccinia
pimpinellae, a new pathogen on anise seed in Egypt. Pl. Pathol. J. 2009, 8(4), 165-169. https://doi.org/10.3923/ppj.2009.165.169 |
|
8. |
Hansen,
H.N.; Smith, R.E. The mechanisms of variation in imperfect fungi: Botrytis
cinerea. Phytopathol. 1932, 37,
369-371. |
|
9. |
Hsuan, H.M.; Salleh, B.; Zakaria, L.
Molecular identification of Fusarium
species in Gibberella fujikuroi
species complex from rice, sugarcane and maize from Peninsular Malaysia. Int.
J. Mol. Sci. 2011, 12(10), 6722-6732. https://doi.org/10.3390/ijms12106722 |
|
10. |
Karlsson,
I.; Edel-Hermann, V.; Gautheron, N.; Durling, M.B.; Kolseth, A.K.; Steinberg,
C.; Persson, P.; Friberg, H. Genus-specific primers for study of Fusarium
communities in field samples. Appl. Environ.
Microbial. 2016, 82(2),
491-501.
https://doi.org/10.1128/aem.02748-15 |
|
11. |
Kim, J.S.; Lee, G.G.;
Kim, J.; Kwon, J.Y.; Kwon, S.T. The development of rapid real‐time PCR
detection system for Vibrio parahaemolyticus
in raw oyster. Lett. In Appl.
Microbiol. 2008, 46(6),
649-654.
https://doi.org/10.1111/j.1472-765x.2008.02368.x |
|
12. |
Leslie, J.F.; Summerell,
B.A. The Fusarium Laboratory
Manual. Blackwell, Oxford. 2006. https://doi.org/10.1002/9780470278376 |
|
13. |
Lindahl, B.D.; Nilsson, R.H.; Tedersoo, L.; Abarenkov, K.;
Carlsen, T.; Kjøller, R.; Kõljalg, U.; Pennanen, T.; Rosendahl, S.; Stenlid,
J.; Kauserud, H. Fungal community analysis by high‐throughput
sequencing of amplified markers–a user's guide. New Phytologist. 2013, 199(1),
288-299.
https://doi.org/10.1111/nph.12243 |
|
14. |
Nicolaisen,
M.; Justesen, A.F.; Knorr, K.; Wang, J.; Pinnschmidt, H.O. Fungal communities
in wheat grain show significant co-existence patterns among species. Fung.
Ecol. 2014, 11, 145-153.
https://doi.org/10.1016/j.funeco.2014.06.002 |
|
15. |
O'Donnell, K.;
Kistler, H.C.; Tacke, B.K.; Casper, H.H. Gene genealogies reveal global
phylogeographic structure and reproductive isolation among lineages of Fusarium graminearum, the fungus
causing wheat scab. Proc. of
the Natl. Acad. of Sci. 2000, 97(14),
7905-7910.
https://doi.org/10.1073/pnas.130193297 |
|
16. |
O'Donnell, K.;
Sutton, D.A.; Fothergill, A.; McCarthy, D.; Rinaldi, M.G.; Brandt, M.E.; Geiser,
D.M. Molecular phylogenetic diversity, multilocus haplotype nomenclature, and
in vitro antifungal resistance
within the Fusarium solani species
complex. J. Clin. Microbiol. 2008,
46(8), 2477-2490.
https://doi.org/10.1128/jcm.02371-07 |
|
17. |
Schoch, C.L.; Seifert, K.A.; Huhndorf, S.; Robert, V.;
Spouge, J.L.; Levesque, C.A.; White, M.M. Nuclear ribosomal internal
transcribed spacer (ITS) region as a universal DNA barcode marker for
Fungi. Proc. Natl. Acad. Sci.
2012, 109(16), 6241-6246. https://doi.org/10.1073/pnas.1207508109 |
|
18. |
Singha, I.M.; Kakoty, Y.; Unni, B.G.; Das, J.; Kalita, M.C.
Identification and characterization of
Fusarium sp. using ITS and RAPD causing Fusarium wilt of tomato isolated
from Assam, North East India. J.
Gen. Engr. Biotechnol. 2016, 14(1), 99-105. https://doi.org/10.1016/j.jgeb.2016.07.001 |
|
19. |
Skovgaard, K.;
Nirenberg, H.I.; O'Donnell, K.; Rosendahl, S. Evolution of Fusarium oxysporum f. sp. vasinfectum races inferred from
multigene genealogies. Phytopathol.
2001, 91(12), 1231-1237. https://doi.org/10.1094/phyto.2001.91.12.1231 |
|
20. |
Suga, H.; Hirayama, Y.; Morishima,
M.; Suzuki, T.; Kageyama, K.; Hyakumachi, M. Development of PCR primers to
identify Fusarium oxysporum f. sp. fragariae. Plt. Dis. 2013, 97,
619-625. https://doi.org/10.1094/pdis-07-12-0663-re |
|
21. |
Vincelli, P.;
Tisserat, N. Nucleic acid–based pathogen detection in applied plant
pathology. Plt. Dis. 2008,
92(5), 660-669. https://doi.org/10.1094/pdis-92-5-0660 |
|
22. |
Zarrin, M.; Ganj, F.;
Faramarzi, S. Development of a polymerase chain reaction-restriction fragment
length polymorphism method for identification of the Fusarium genus using the transcription elongation factor-1α
gene. Biomed. Rep. 2016,
5(6), 705-708. https://doi.org/10.3892/br.2016.783 |

This work is licensed under the
Creative Commons Attribution
4.0
License (CC BY-NC 4.0).
Abstract
The identification of Fusarium species associated with Fusarium
wilt of eggplant is an important step toward accurate diagnosis and management
of the disease. In this study, 32 Fusarium
isolates recovered from Fusarium wilt-infected eggplants in 15 communities
across the Ashanti, Eastern and Volta Regions of Ghana were identified and
characterized based on their morphological and molecular properties. Colony and
conidia characteristics were used to identify and characterise the isolates
morphologically. Genomic DNA of the Fusarium
isolates was extracted and the Internal Transcribed Spacer (ITS) primer (ITS1F)
and Translation Elongation Factor (TEF) primer (Fa-7_Ra-6F) were used to sequence the ITS and TEF
regions of the isolates’ DNA respectively.
Most of the Fusarium isolates were
morphologically identified as Fusarium
solani, F. oxysporum, or F. culmorum and
were confirmed by the ITS and TEF region sequences. Morphological characterisation
offers limited distinction among isolates of the same Fusarium species. Morphological characteristics, such as conidia
shape and size, appeared uniform for the Fusarium species, except for F. solani, which was grouped into two
based on sporodochia production. Both ITS and TEF region sequences could detect
differences among the Fusarium
isolates. However, there were differences in the phylogenetic grouping between
the ITS and TEF region sequences. The TEF sequence showed wider divergence in
the F. oxysporum and F. culmorum isolates but a close
relationship in the F. solani
isolates. Fusarium oxysporum isolates
were the most phylogenetically diverse.
Abstract Keywords
Fusarium species, eggplant, molecular identification, wilt, pathogen.
This work is licensed under the
Creative Commons Attribution
4.0
License (CC BY-NC 4.0).
Editor-in-Chief


This work is licensed under the
Creative Commons Attribution 4.0
License.(CC BY-NC 4.0).